
Candlestick patterns and more!
This page outlines candlestick patterns, resources and tools you can utilize to increase your trading accuracy along with utilizing AI Signals.

Chart Patterns Automatically Printed on your charts.
(See Video Below)
Day Trading and Swing Trading Topics
It’s easy to make money in the stock market — sell stocks for more than you paid for them. The tricky part is figuring out when to buy and sell. Whether you’re trading stocks, forex, or more, you need a strategy that aligns with your trading plan and accelerates your growth as a trader.
Fortunately, you have plenty of tools at hand that let you stop guessing and apply what you and other market enthusiasts have discovered about market trends. Tools that visualize the current market signals can help you take advantage of trends and make trading decisions with confidence.
When looking for the best day trading set ups we recommend using AI signals to spot bullish patterns meaning the asset may be going up in value and bearish patterns meaning the asset may be going down in value.
You can also utilize the free chart patterns that are built in the TradingView as they will propagate on your chart in real time and you can use them simultaneously with AI signals.
When trading you will notice both bullish candlestick patterns and bearish candlestick patterns on multiple time frames and charts, so be sure to utilize multiple time frames before making a trading decision. Also Remember to look for a reversal candlestick patterns and to follow the indicator coupled with your best judgment while trading live.
Even the best indicators for day trading can sometimes get thrown for a loop during wild market action. It's best to use a combination of indicators and chart patterns to make sure you give yourself the best probability of making a profitable trade.
Day trading is the practice of buying and selling financial instruments, such as stocks, within the same trading day. This means that a day trader will open and close all positions within a single trading day, and will not hold any positions overnight. Day trading is a strategy that requires a lot of skill and discipline, as it involves making quick decisions based on real-time market data.
Technical analysis is a method of evaluating securities by analyzing statistics generated by market activity, such as past prices and volume. Technical analysts believe that market trends, as shown on a chart, can predict future activity. They use charts and other tools to identify patterns and trends that can indicate buy or sell signals.
Candlestick patterns are one of the most commonly used technical analysis tools in day trading. A candlestick chart is a type of financial chart that shows the open, high, low, and close prices for a given time period. Each candlestick on the chart represents this information for a specific time period, such as one day or one hour. Candlestick patterns are formed when the open, high, low, and close prices for a given time period create distinct patterns on the chart. These patterns can indicate potential buying or selling opportunities.
Day Trading Setups
Let’s start with what it takes to get you into a stock. Perhaps you wait until the price drops below a certain threshold before you’re willing to buy. Or, you may choose to jump in when you notice a particular trading trend — up or down. You may watch for opportunities soon after the markets open in the morning or wait until the end of the day when volatility tends to pick up.
What’s Your Day Trading Style?
No two day traders are exactly the same. Some are slow to react, while others can make trading decisions in minutes. Some embrace volatility as a sign they’re on the right track, but others would rather avoid the risk. Whether you’re driven to spend time analyzing stock trends or don’t mind bucking the trends, you need tools to help you sort through the plethora of information available at a given moment of the day.
Whether you’re into Forex day trading or stock day trading, learning the best indicators for day trading is more than useful. They’re essential to reducing risk and boosting confidence in your trading decisions. The more you understand the indicators — moving averages, volume, relative strength, Stochastic oscillators, VWAP, and more — the more you understand the data you find in trading charts like those on TradingView free and premium versions.
Picking Up the Stock Signals
Setting up the triggers for buying and selling is just the first part of the equation. You also need to keep an eye on the stock signals to identify when the market meets your specific criteria. Whether they rely on moving averages, oscillators, relative strength index, or any number of technical indicators, the tools you use should give you all the data you need to make trading decisions.
Trading Signals
Monitoring stock signals is just one piece of the puzzle. It’s great to know how a stock is performing and the patterns that suggest what’s happening with it. You also rely on trading signals. Based on mathematical algorithms, these technical indicators act as a trigger for when you want to buy or sell a specific stock or other security.
Traders can use any number of trading charts to help them define their trading signals, including a bar chart, line chart, and candlestick. When you go to view a TradingView chart, you can access all of these and more to help you identify patterns that can help you make better trading decisions. Here are some of the charts you may see:
Bar chart: Bars on the chart represent four different prices for the day: opening, closing, highest, and lowest
Candlestick chart: Includes data from multiple time frames in a single chart that uses candlestick-shaped boxes to represent the opening and closing prices
Line chart: A single line shows the rises and falls of the security’s closing price each day
Point & figure chart: Uses a combination of Xs and Os to show rising and falling prices
Renko chart: Instead of charting prices, a Renko chart shows when the market moves up or down
Volume chart: Uses a bar chart or candlestick chart to indicate market activity as seen through the number of shares traded
Forex Signals
Forex signals serve the same purpose as trading signals — they help you make buying and selling decisions. However, the nature of Forex trading differs from other securities, which means you need a different approach. Although you can find a variety of signal types available, the four most common signals may be sufficient for your needs.
Action
An action signal is a buy or sell statement that’s fairly direct and easy to understand. You may use moving averages, Bollinger bands, or relative strength index to determine when you want to buy or sell a commodity. The action then takes place when the conditions are met.
Current Market Price
Compared to other Forex signals, the current market price simply gives you a comparison of the price that triggered the trade and the price at the actual moment of the trade. This information can be helpful for future trades, as it can indicate opportunities to buy.
Stop Loss
You can use a stop loss to indicate when it’s time to sell a commodity. In most cases, you set the price at which you want to sell, and this helps limit potential losses when the price starts to fall.
Take Profit
When the profit level reaches a pre-determined rate, a take-profit signal can trigger a sell-off. This lets you sell the commodity at a time that maximizes your profit — at least to the extent that you’re willing to accept.
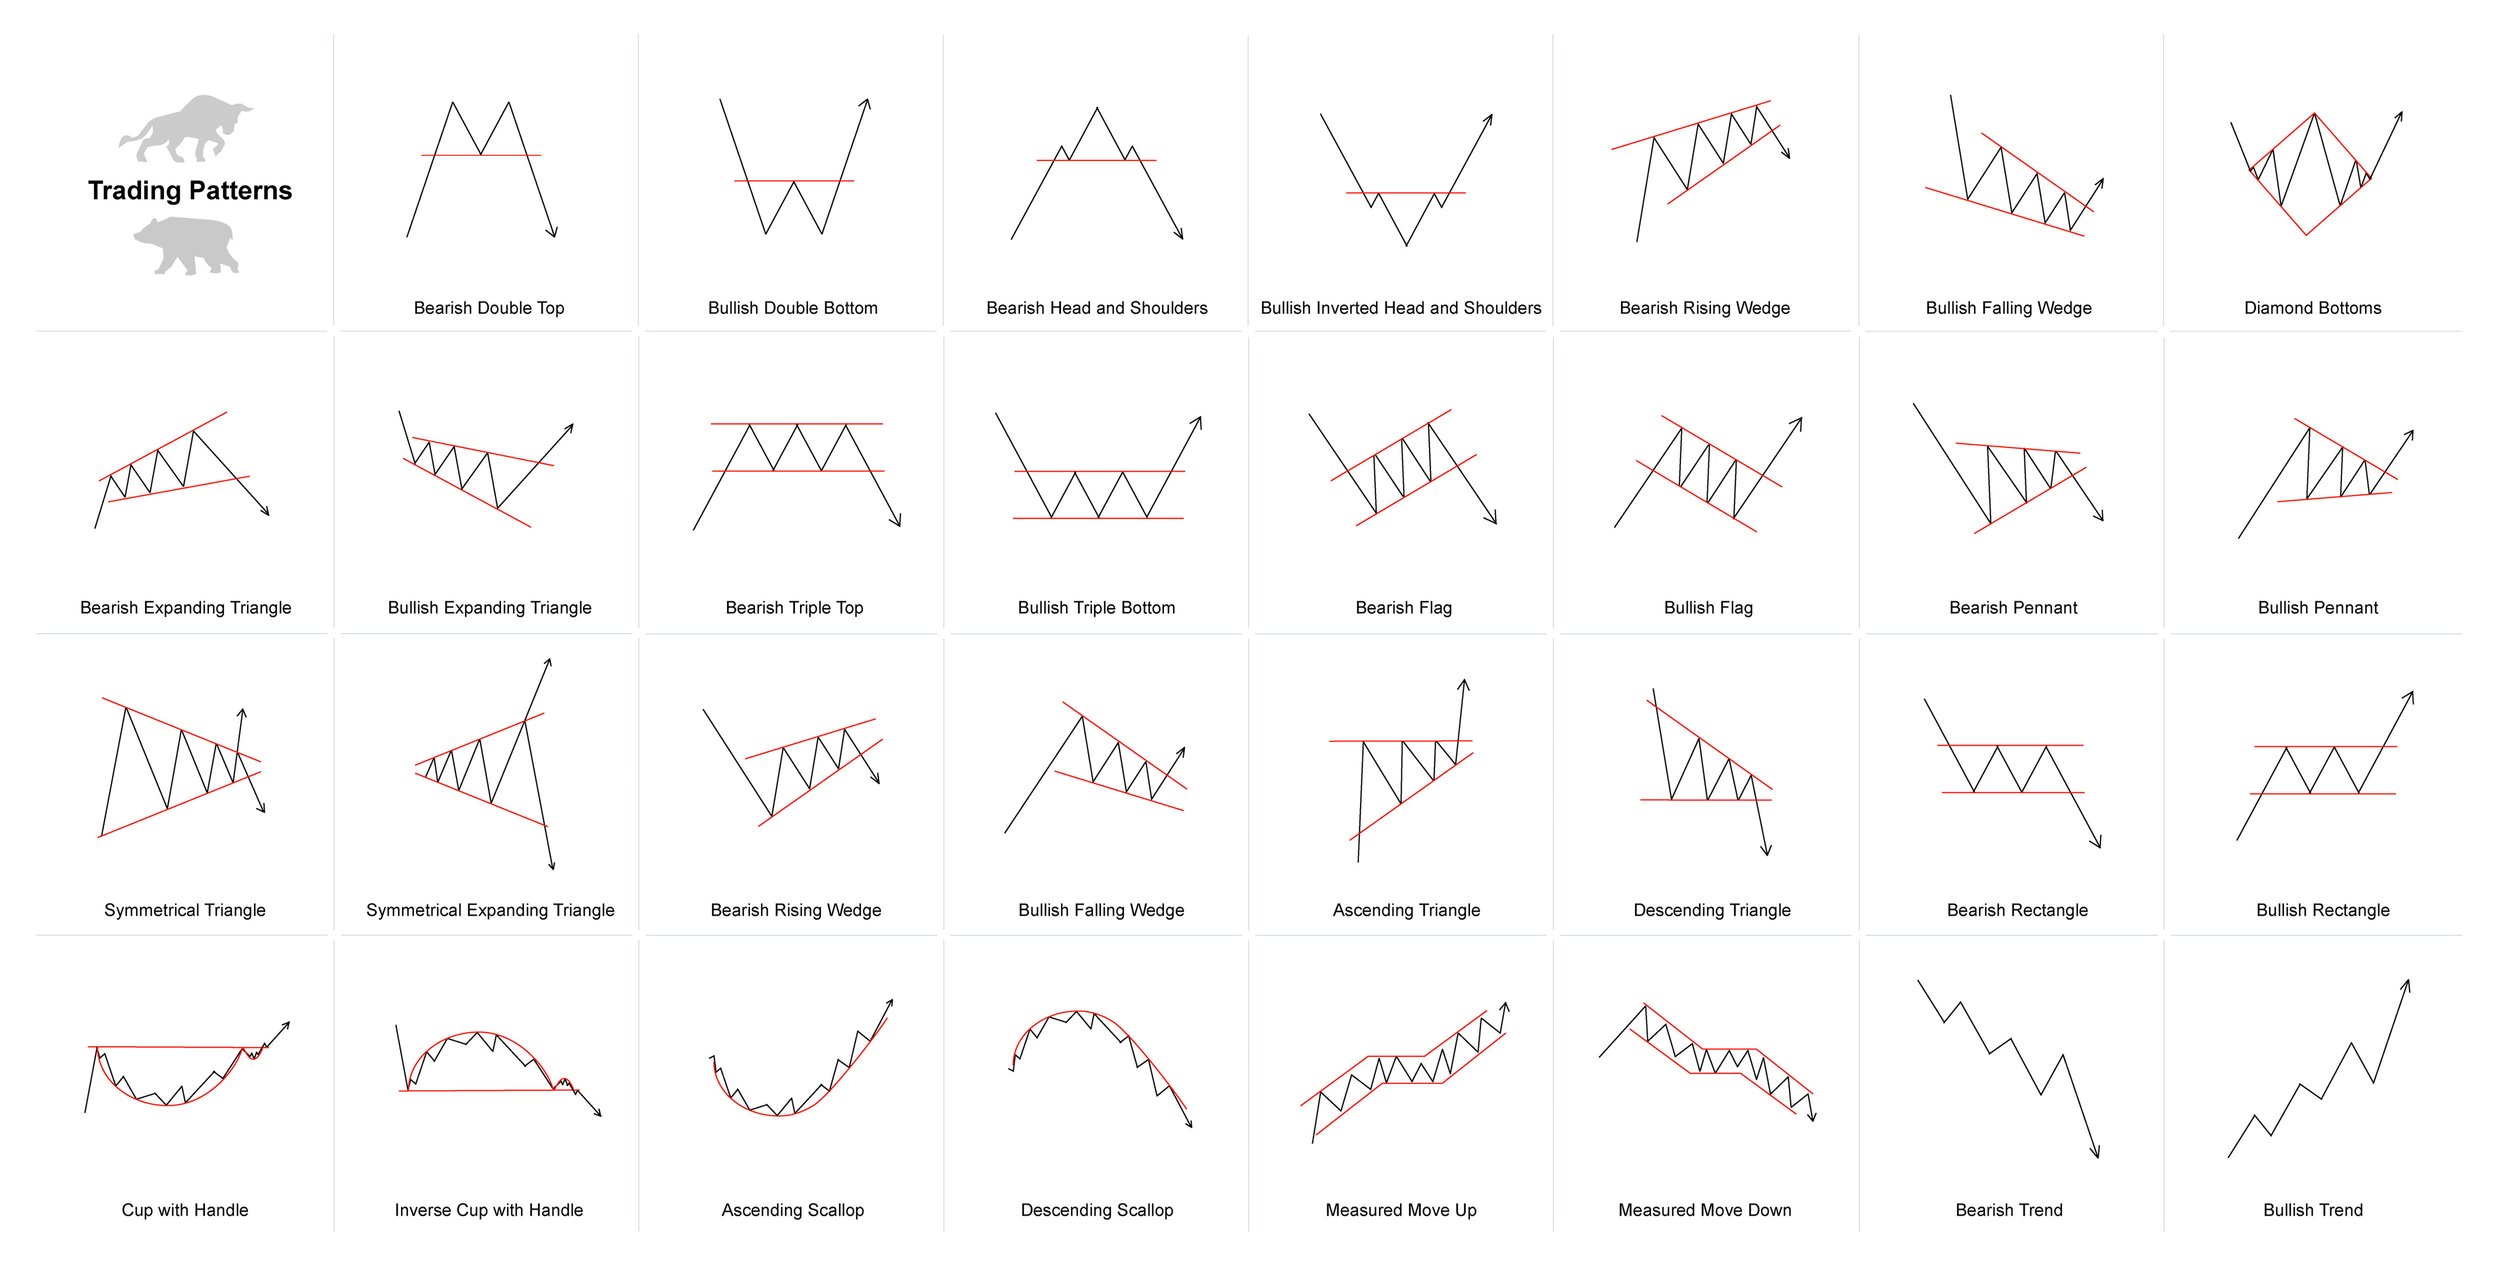
Trading Chart Patterns
Charts offer visual clues that tell you it’s time to trade. Many trading chart patterns are simple shapes or configurations that you can easily identify.
Forex Chart Patterns
Head and shoulders: This pattern can take one of two forms. You may notice a topping formation following a steady price increase or bottoming at the end of a price decrease. The top or bottom forms what’s called the head, while the rising and falling make up the shoulder. If you can see this pattern, you can locate entry points as well as stop levels and exits.
Ichimoku: An Ichimoku cloud adds price data to the chart. When reading the chart, look for whether the action is taking place above or below the cloud. This allows you to see entry points that may not be as obvious in other patterns.
Triangles: If you’re trading on a short-term time frame, you may watch for triangles. This lets you see when prices tighten as the gap between the extremes tightens. Triangles take on several shapes, including symmetric, ascending, or descending; however, the shape of the triangle is less important than the ability to identify one in the data.
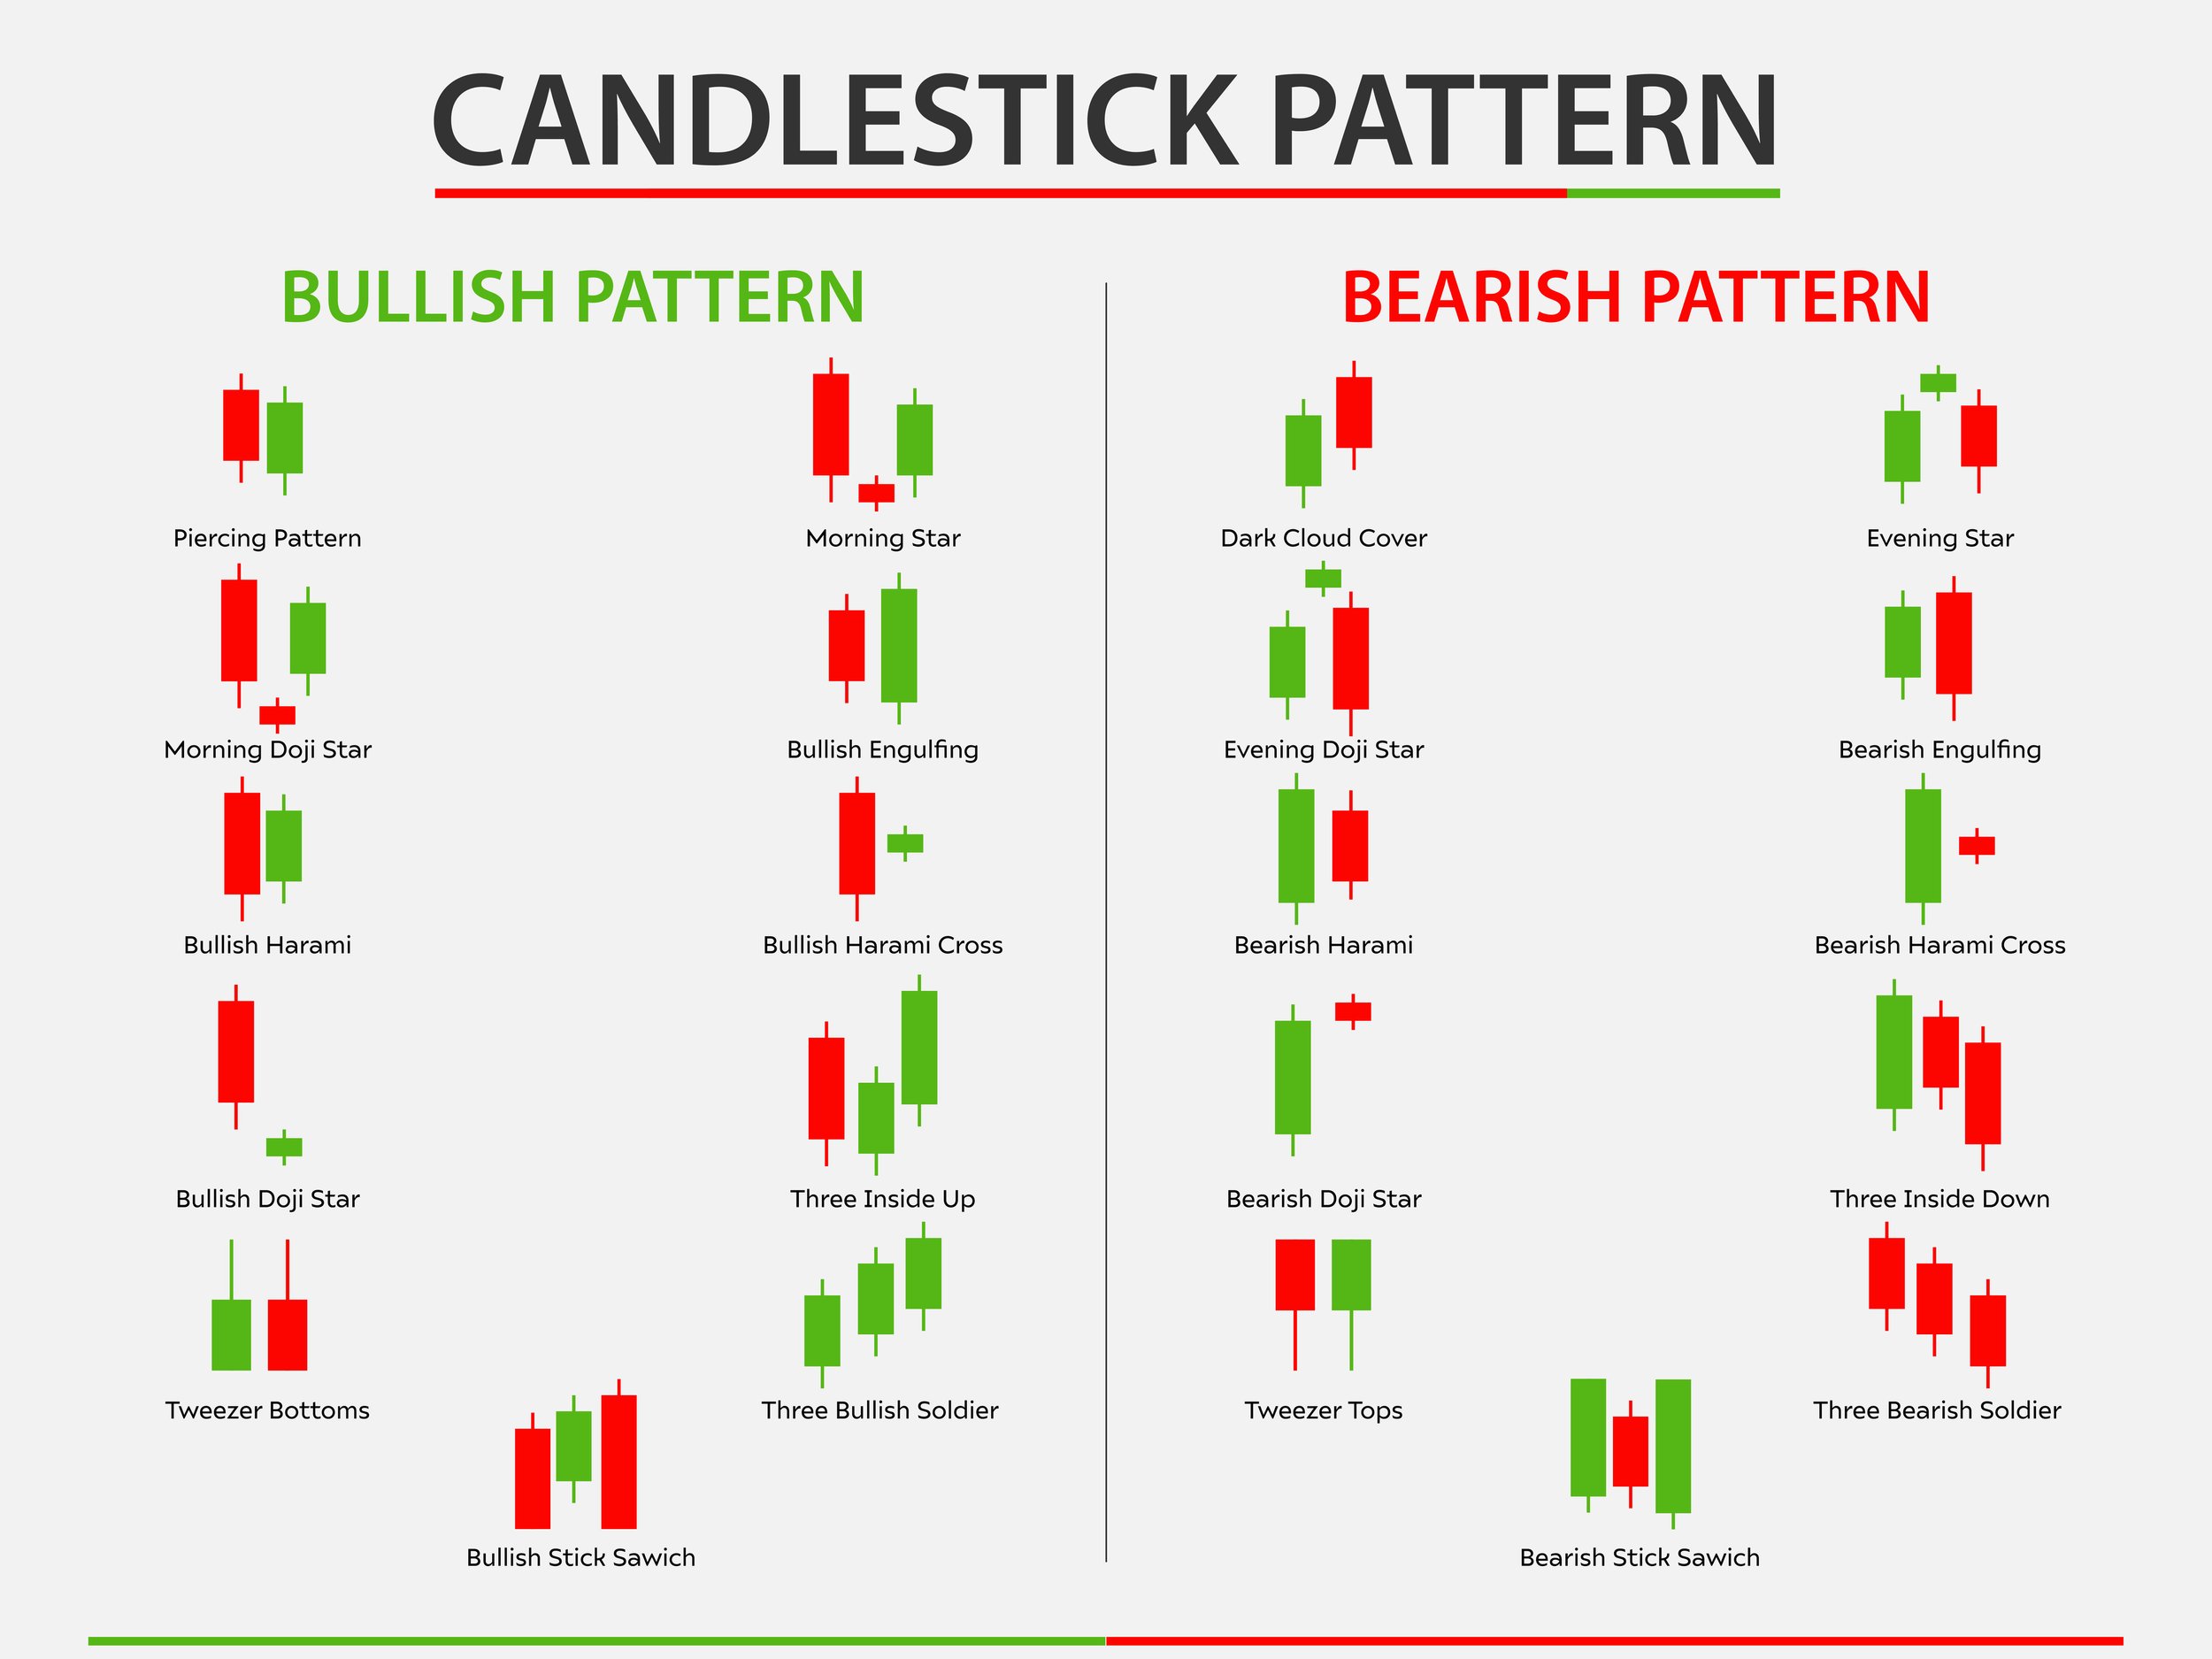
Candlestick Pattern
Candlestick patterns have been around for a while — Japanese rice traders were using them as early as the 18th century. They’re wildly popular today for predicting the direction of a price because they’re simple and easy to use. The candlestick’s “body” gives you the daily price range from open to close. The wick gives you the high and low prices for the day.
Color is also an indicator. Some charts use specific colors to indicate rising and falling prices. Others may use outlines and filled bars to represent the prices. For this discussion, we’ll use red for dropping prices and green for rising prices.
Learn how to read a candlestick pattern, and you have a powerful tool for identifying opportunities and making trading decisions.
Bullish Candlestick Patterns and More
When bullish patterns appear in a chart, the market may be headed for an uptrend. From a trading perspective, these patterns suggest it may be time to switch from a short to a long position and capitalize on potential profit.
Bullish Engulfing
To get a bullish engulfing pattern, you need two candlesticks — one with a red body and one with a green body. The green body is larger than the red body, creating the engulfing effect. In this case, the market tends to move the price up. A bullish engulfing candle is a type of candlestick pattern that is often seen as a bullish signal in the world of technical analysis. This pattern is formed when a large white candle fully engulfs the previous day's black candle, meaning that the open, low, and close of the white candle are all higher than the corresponding values of the black candle.
The bullish engulfing pattern is considered a strong bullish signal because it indicates that the bulls have taken control of the market and are pushing prices higher. This pattern is often seen as a sign that the bulls are gaining strength and that the overall trend is likely to continue in the same direction.
One way to trade the bullish engulfing pattern is to wait for it to form and then enter a long position at the open of the next candle. This strategy is based on the assumption that the bullish momentum will continue and that prices will continue to move higher.
Another way to trade the bullish engulfing pattern is to enter a long position as soon as the pattern forms. This strategy is based on the assumption that the bulls have already taken control of the market and that prices are likely to continue moving higher in the short term.
Overall, the bullish engulfing pattern is a strong bullish signal that can be used by traders to make profitable trades in the market. It is important to remember, however, that like all technical analysis tools, the bullish engulfing pattern is not a guarantee of future market performance and should be used in conjunction with other analysis techniques.
Hammer
A hammer has a distinctive look on a chart: a long wick topped by a short body. Hammers show up when the stock faced significant selling pressure during the trading day and ended with enough buying pressure to push the stock price up again.
Inverted Hammer
The inverted hammer has a long wick that stretches above the body. When this appears in a chart, it indicates a strong selling pressure during the trading day that wasn’t enough to push down its price.
Morning Star
One of two three-stick patterns, the morning star appears in the midst of a downtrend. The three candlesticks include two long sticks (one red and one green) flanking a single short candlestick. This short stick represents the peak of the selling pressure for the period, and the longer stick to its right promises a trending price increase.
Piercing Line
Another two-candlestick pattern, the piercing line involves two long candles — one red and one green. In this case, you may notice a gap between one candle’s closing price and the following opening price. This pattern suggests strong buying pressure is at work, moving the price upward and past the previous day’s mid-price.
Three White Soldiers
The candlesticks in the three white soldiers pattern represent prices over a three-day period. Each of the three long sticks with short wicks inches higher over the course of the three days. When you see this pattern, you can expect to see more buying pressure and price increases.
Bearish Candlestick Patterns
The names of many bearish candlestick patterns reveal there’s a different type of movement taking place in the market. These patterns indicate a downturn in the market, which may be time to consider a short position to make the most out of falling prices. A bearish candlestick pattern is a type of chart formation that indicates a potential downward trend in the price of a security. These patterns are named after the appearance of the candlesticks on a chart, which resemble the body and claws of a bear. Some common bearish patterns include the bearish engulfing pattern, the bearish harami, and the bearish shooting star. These patterns are formed when the open and close prices of a security are near the bottom of the trading range, and the pattern is confirmed when the price continues to decline in subsequent trading sessions. Investors may use bearish candlestick patterns as a signal to sell or short a security.
Bearish Engulfing
A bearish engulfing pattern shows up as the market begins to experience a downturn. In this two-candlestick pattern, the green stick engulfs the red stick as the price drops. If you notice this pattern, pay attention to the depth of the second candlestick, as the downtrend tends to mirror how low it goes.
Dark Cloud Cover
The dark cloud cover pattern involves two candlesticks — green followed by red. In this pattern, the red candlestick opens higher than the green stick, suggesting a price drop. Short wicks indicate a stronger pattern.
Evening Star
In this three-candlestick pattern, you’ll see a short stick surrounded by two long candles — green on the left and red on the right. If the last candlestick obliterates the gains achieved by the first candle, the market reversal could be particularly strong.
Hanging Man
The hanging man is essentially the opposite of the hammer. It features a short body on top of a long wick, and it tells traders that even though the price ended on a high note, the stock faced a significant sell-off.
Shooting Star
Similar to the inverted hammer, the shooting star pattern has a short body topped by a long wick. You’ll see this pattern at the end of an uptrend and will likely watch the stock’s price fall over the next few days.
Three Black Crows
Another three-candlestick pattern, three black crows, includes three long red candles. Each candlestick has a short wick (or no wick at all) as the result of prices that drop lower each consecutive day. Traders take note when they see this pattern, as it suggests sellers are pushing the prices down.
Reversal Candlestick Patterns
Reversal candlestick patterns predict a change in the direction of a stock’s price. They can appear before an upturn or a downturn, suggesting buying or selling sprees that can affect the trader’s profit. We’ve already looked at two common reversal patterns: three black crows and evening star. Here are two more. A reversal candlestick pattern is a type of chart pattern that indicates a potential change in the direction of a stock's price. This type of pattern is formed when the price of a stock moves significantly in one direction and then reverses, creating a distinct visual pattern on a candlestick chart. There are several different types of reversal candlestick patterns, including the doji, the hammer, and the shooting star. These patterns are typically used by technical analysts to identify potential turning points in a stock's price, and can be a useful tool for making investment decisions.
Abandoned Baby
The abandoned baby pattern typically shows up near the end of a price downturn. In this three-stick pattern, a short-bodied stick (or Doji) is surrounded by two longer sticks. The center candlestick represents the point where the price levels out. A long green candlestick to the right suggests prices are moving upward, while a long red candlestick to the right suggests the opposite.
Three Line Strike
The three-line strike pattern features three candlesticks with progressively higher or lower closing prices, suggesting the prices will continue to move in that direction. This pattern can precede rises or falls, and you’ll know from the color of the stick. Notably, this pattern is relatively rare, but it has a high accuracy rate.
Day trading is the practice of buying and selling financial instruments, such as stocks, currencies, or futures contracts, within the same trading day. Day traders typically hold their positions for a very short time, often just a few minutes or hours, and they aim to profit from small price movements in the market.
Technical analysis is a key tool that day traders use to make informed decisions about when to buy and sell securities. Technical analysis involves the study of past market data, such as price and volume, to identify patterns and trends that can be used to forecast future market movements. Technical analysts often use charts to visualize and analyze market data, and there are many different types of charts and chart patterns that can be used for this purpose.
One of the most commonly used chart patterns in technical analysis is the trend line. A trend line is a straight line that is drawn on a chart to connect two or more price points and to show the overall direction of the market. A rising trend line indicates that the market is in an uptrend, while a falling trend line indicates that the market is in a downtrend. Trend lines can be used to identify support and resistance levels, as well as to determine when a trend is likely to continue or reverse.
Another important chart pattern in technical analysis is the moving average. A moving average is a trend-following indicator that uses a statistical formula to smooth out price data and to identify the overall direction of the market. There are several different types of moving averages, including the simple moving average, the exponential moving average, and the weighted moving average. Moving averages can be used to identify trends, to generate buy and sell signals, and to confirm other technical indicators.
In addition to trend lines and moving averages, there are many other chart patterns that can be used in technical analysis, including head and shoulders, triangles, and flags. Each of these patterns has its own unique characteristics and can provide valuable information to traders about the strength and direction of the market. However, it is important to remember that no single chart pattern is foolproof, and that technical analysis should always be used in conjunction with other tools and techniques, such as fundamental analysis and risk management.
Get Your Free Trial of AI Signals!
Ready to try out AI Signals For FREE for 7 days on your tradingview charts? Click the button below to get started.
